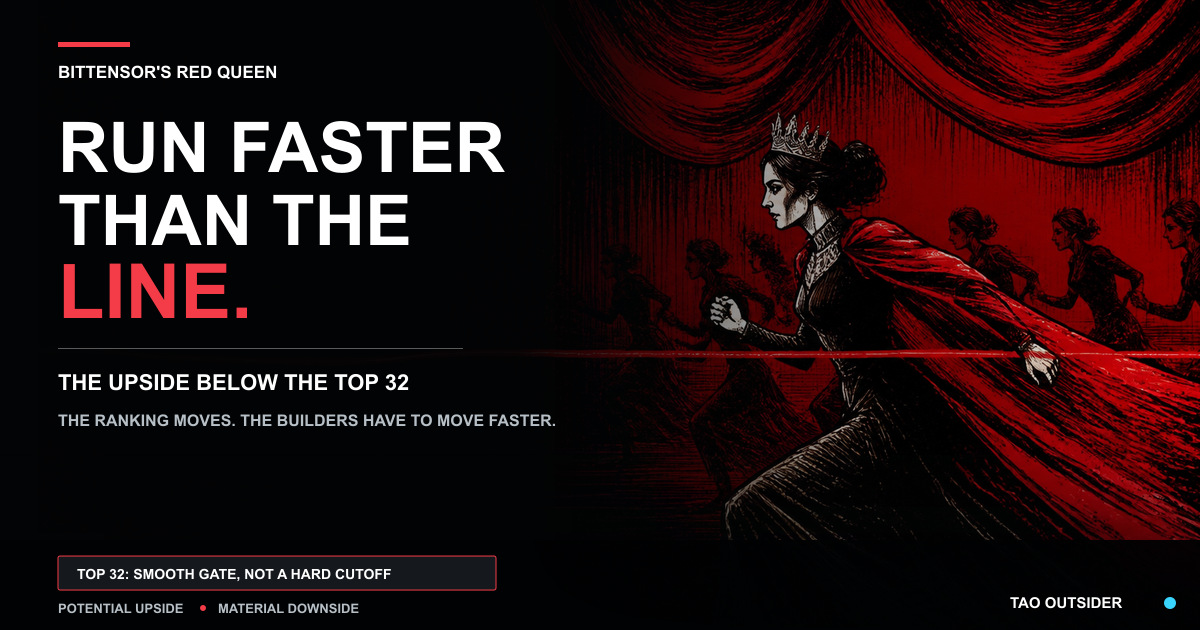
The most interesting Bittensor subnets may be the ones that have not reached the Top 32 yet.
That sounds wrong at first. The current emission gate concentrates most of the network’s TAO allocation around the strongest adjusted demand shares. A subnet deep in the tail can receive almost nothing. The leaders already have capital, attention and emission, yet the line below them is where the asymmetry begins.
A subnet sitting below the Top 32 is not automatically dead. It may be early, ignored, poorly distributed or simply weak. The investor’s job is to tell those conditions apart. If a team is producing more than its current rank reflects, the move toward the gate can change its economics much faster than another incremental gain by a subnet that already sits near the top.
My thesis begins there. The highest percentage upside can exist below the Top 32 because much of a leader’s success is already visible in its price, demand and emission position. The investor’s real work is to identify the subnet whose delivery is beginning to deserve a place near the top before the wider market reaches the same conclusion. Getting that research right can produce a larger percentage return than buying an established leader after recognition has already arrived. The downside is larger there too. This is a research framework, not a claim that every low-ranked alpha token is cheap or that crossing the gate guarantees a profitable trade.
The best way to understand the race brings evolutionary biology together with Lewis Carroll and a study of more than 4,700 competitive business actions.
Why it is called the Red Queen effect
The Red Queen comes from Lewis Carroll’s 1871 novel Through the Looking-Glass.
Alice runs with the Red Queen but discovers they have remained under the same tree. The Queen explains that, in her country, “it takes all the running you can do, to keep in the same place.”
Evolutionary biologist Leigh Van Valen borrowed that image in 1973. His Red Queen hypothesis described environments in which one species’ adaptation changes the effective environment for others. A gain in relative fitness does not freeze the contest. Predators, prey, parasites, hosts and competitors keep adapting around one another.
Management researchers later applied the same idea to companies.
Pamela Derfus, Patrick Maggitti, Curtis Grimm and Ken Smith studied more than 4,700 competitive actions across several industries. Their finding was conditional rather than magical. A company’s actions could improve its performance while also increasing the number and speed of rival responses. Those responses then reduced part of the original advantage. Industry context and market position changed the strength of the effect.
The study did not say that challengers always defeat leaders. It showed why success can provoke the competition that makes success harder to preserve.
Bittensor has turned that tension into protocol economics.
Bittensor now has its own Red Queen race
Bittensor is a network of competing markets. Each subnet defines a task, miners compete to produce an output, validators score that work and the chain distributes incentives through its consensus and emission systems.
Dynamic TAO added another contest. TAO holders can express demand for individual subnet alpha tokens. The subnet’s smoothed market price enters the cross-subnet allocation process. Recent runtime changes made that process far more selective.
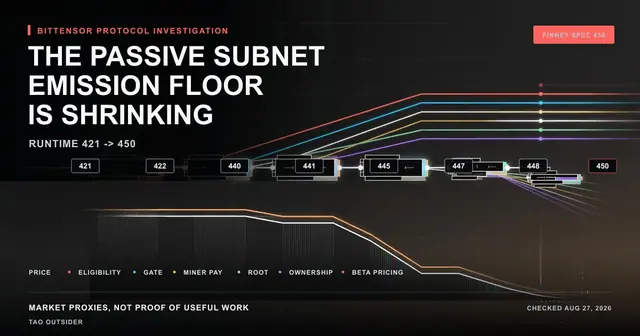
Runtime 440 introduced a smooth emission gate. Runtime 441 added a rank mode. On the active Runtime 452 code reviewed for this article, the default midpoint is the 32nd-highest positive adjusted demand share, and the default Hill exponent is 3.
The ranking input is not a product-quality score. It begins with each eligible subnet’s moving alpha price share. The runtime then reduces that share according to MinerBurned, the proportion of miner incentive withheld through owner-controlled hotkeys. The emission gate is applied to the adjusted distribution, and the surviving weights are normalized again.
In simplified form:
adjusted share = moving price share * (1 - MinerBurned)

gate multiplier = 1 / (1 + (theta / adjusted share)^3)
theta is the adjusted share at the gate position. Under the current default, that position is rank 32.
At the midpoint, half of a subnet’s adjusted weight passes through the gate. Well above it, almost all passes. Deep below it, the multiplier approaches zero.
No universal guillotine cuts rank 33 to zero. The curve remains smooth. Rank 33 can receive emission, and a subnet farther down can move upward if its adjusted demand improves. The hard part is that the other 127 subnets are moving too.
What the Top 32 currently concentrates
I pulled a public TaoSwap subnet snapshot at 00.38 UTC on September 1, 2026, while Finney was running specVersion 452.
The dataset contained 128 non-root subnets. Ninety had network emission enabled. I ranked the field by moving price after applying the reported MinerBurned percentage, matching the two inputs used before the gate in Runtime 452.
The first 32 adjusted-demand ranks received approximately 95.4% of reported network emission. The other 96 received about 4.6%.
| Adjusted demand group | Share of reported network emission |
|---|---|
| Ranks 1 to 32 | 95.4% |
| Ranks 33 to 128 | 4.6% |
This is a Tao Outsider calculation from a secondary public API snapshot, not a guarantee that the same percentages will persist. Emission-enabled status, MinerBurned, moving prices and positions can change. The point is the shape.
The chain is concentrating economic support. The tail is still in the game, but it has to earn its way toward a much steeper part of the curve.
The opportunity lives near the curve, not everywhere below it
Calling every subnet below rank 32 an opportunity would be lazy.
Some are below the gate because the product is early. Some have weak distribution. Some have no active market, no credible scoring or no reason for external users to care. A few may be abandoned while their alpha token still trades.
The useful hunting ground is narrower. It consists of subnets whose observable execution looks stronger than their adjusted demand rank.
The gate makes that mismatch potentially valuable because its response is nonlinear.
Consider a simplified subnet whose adjusted share rises from 0.75 times theta to 1.25 times theta. With exponent 3, the gate multiplier rises from roughly 29.7% to 66.1%. The raw adjusted share also increased. Before the final network-wide normalization, its gated weight is roughly 3.7 times larger.
| Adjusted share relative to theta | Gate multiplier | Gated weight relative to theta |
|---|---|---|
| 0.50 | 11.1% | 0.056 |
| 0.75 | 29.7% | 0.223 |
| 1.00 | 50.0% | 0.500 |
| 1.25 | 66.1% | 0.826 |
| 1.50 | 77.1% | 1.157 |
| 2.00 | 88.9% | 1.778 |
These figures illustrate the gate formula, not a forecast of final emission. Every subnet’s weight is normalized against the rest of the network. A rival can improve at the same time. MinerBurned can reduce the input. A subnet with network emission disabled still receives zero TAO-side share after the gate.
The mathematical point survives those caveats. Near the midpoint, progress can change a subnet’s emission economics faster than a linear model suggests.
Why leaders still deserve respect
The Red Queen thesis does not make the Top 32 unattractive by definition.
Leaders usually have advantages that challengers lack, including liquidity, distribution, experienced teams, validator relationships, product visibility and a larger budget for miners. Their position can reflect real execution.
The business study found that market position matters. Strong incumbents are not waiting passively to be overtaken. They learn from challengers and can respond with more resources.
The same applies to Bittensor. A subnet crossing rank 32 does not arrive at an empty throne. It displaces a competitor that has reasons to defend its position.
The investment distinction is between quality and asymmetry.
A leader may offer stronger evidence and lower execution risk. A credible challenger may offer more percentage upside because less success is reflected in its current price and emission position. It also carries a higher probability of never crossing the line.
Potential return and expected return are different things.
How I would research the subnets below the Top 32
The screen starts with rank, but it cannot end there.
1. Find production, not promises
Look for a product people can use, code that changes, measurable output, public endpoints, customers, revenue evidence or a clear research artifact. A roadmap is weaker than a working surface.
2. Measure delivery velocity
One good release does not establish adaptation. The Red Queen question is whether the team keeps shipping as the competitive standard changes. GitHub history, product updates and resolved technical failures matter more than a burst of launch content.
3. Ask who creates the demand
Price can reflect conviction, marketing, concentrated wallets or real product expectations. Holder concentration, liquidity depth, inflows, outflows and the identity of large participants help distinguish broad discovery from a thin move.
4. Read the incentive mechanism
A subnet can have a compelling product and a weak market design. Miners need a task they can compete on. Validators need a scoring system that can distinguish useful work. Owners need incentives that do not turn the network into a private reward loop.
5. Check MinerBurned and emission eligibility
Adjusted demand can differ sharply from raw moving price when miner incentives are withheld. A high price does not guarantee a high gate rank. A subnet with emission disabled may have a market while receiving no TAO-side network share.
6. Estimate the distance to theta
Rank alone hides magnitude. The 33rd subnet can sit just below the midpoint or far below it. The research question is how much adjusted demand would be needed to approach the bar and whether the available liquidity can support that move without extreme slippage.
7. Identify the catalyst that can close the gap
The best candidate needs a path from delivery to demand. That path might be a public launch, external revenue, better distribution, a validator upgrade, stronger miner participation or evidence that the product solves a problem outside the Bittensor capital loop.
Without a catalyst, “undervalued” can remain a story told by holders to one another.
The Red Queen raises the standard for everyone
The Top 32 is a fixed rank position under the current default. The share needed to occupy it is not fixed.
If several tail subnets attract more demand, the 32nd-highest adjusted share rises. A challenger can improve and remain below the gate because its competitors improved faster. A leader can ship a real product update and lose relative position because the field moved further.
This moving competitive threshold is the Red Queen effect in its cleanest Bittensor form.
The protocol creates a feedback loop:
- A subnet improves its product or market execution.
- Demand and adjusted share can rise.
- Its emission position improves.
- Rivals respond with releases, incentives, distribution or price support.
- The standard required to remain near the Top 32 rises.
This can make Bittensor better. It can also make the market more reflexive.
Teams may optimize for visible releases instead of durable utility. Investors may mistake marketing velocity for product velocity. Capital can concentrate around a narrative before customers arrive. A protocol that allocates by demand cannot automatically tell whether the demand is wise.
What the chain still cannot measure
The emission gate is selective. It is not an oracle for useful work.
Moving price measures market demand filtered over time. MinerBurned measures one form of owner capture. Validator scoring measures whatever each subnet mechanism was designed to evaluate. None of those fields directly proves revenue, customer retention, scientific validity or social value.
That limitation creates both the risk and the opportunity.
If the chain measured product value perfectly, there would be little research edge. Every strong subnet would be recognized immediately. In reality, the market can be early, late or wrong.
My view is that the most interesting upside often sits where public evidence is improving faster than adjusted demand rank. The investor earns that possibility by doing work the ranking cannot do alone. That means reading code, testing products, tracking teams, understanding incentives and deciding whether the market is missing something real.
The Top 32 tells us where the protocol is concentrating emission today. It does not tell us which subnet deserves to be there tomorrow.
The Tao Outsider read
The Top 32 marks a pressure boundary, not a list of permanent winners.
Above it, subnets receive most of the network’s economic support and must keep producing to defend that position. Below it, weak projects can fade toward zero while credible challengers compete for the largest change in relative economics.
I look for upside below the gate, among teams already building at a level their current position may not reflect.
The Red Queen makes the thesis harder, not easier. Finding a good subnet is insufficient. It has to improve faster than a field that is learning from every successful move.
In Bittensor, running keeps a subnet in the race. Reaching the Top 32 requires running faster than the market expected.
FAQ
Does Bittensor give all subnet emission to the Top 32?
The current gate remains smooth. Rank 32 is the default midpoint, where half of adjusted weight passes through. Subnets below it can still receive emission, while those deep in the tail may receive very little after gating and normalization.
Why can a subnet below the Top 32 have more upside?
A credible subnet below the gate may have more percentage upside if its product execution is improving faster than its current demand rank reflects. Approaching the midpoint can produce a nonlinear change in gated weight. The same subnet also carries greater failure and liquidity risk.
Is a subnet below rank 32 undervalued?
Rank does not establish valuation. Investors still need to examine product evidence, demand quality, liquidity, miner participation, validator scoring, emission eligibility, MinerBurned and the catalyst required to improve relative position.
Is this a subnet investment recommendation?
This article offers a research framework for understanding Bittensor’s emission competition, not a recommendation to buy a subnet token. Alpha tokens can be volatile, illiquid and exposed to protocol, product, team and market risk.
Sources
Lewis Carroll: Through the Looking-Glass
University of Chicago Press: Leigh Van Valen’s A New Evolutionary Law
University of Chicago: Leigh Van Valen and the Red Queen hypothesis
Academy of Management Journal: The Red Queen Effect: Competitive Actions and Firm Performance
Bittensor V440: The Emission Gate
Subtensor Runtime 452: Emission gate implementation
Subtensor Runtime 452: Emission gate storage defaults
TaoSwap: Public subnet data API
Tao Outsider: How Bittensor rewired subnet emissions from Runtime 421 to 450
Was this article useful?
One tap feedback helps us improve each post.