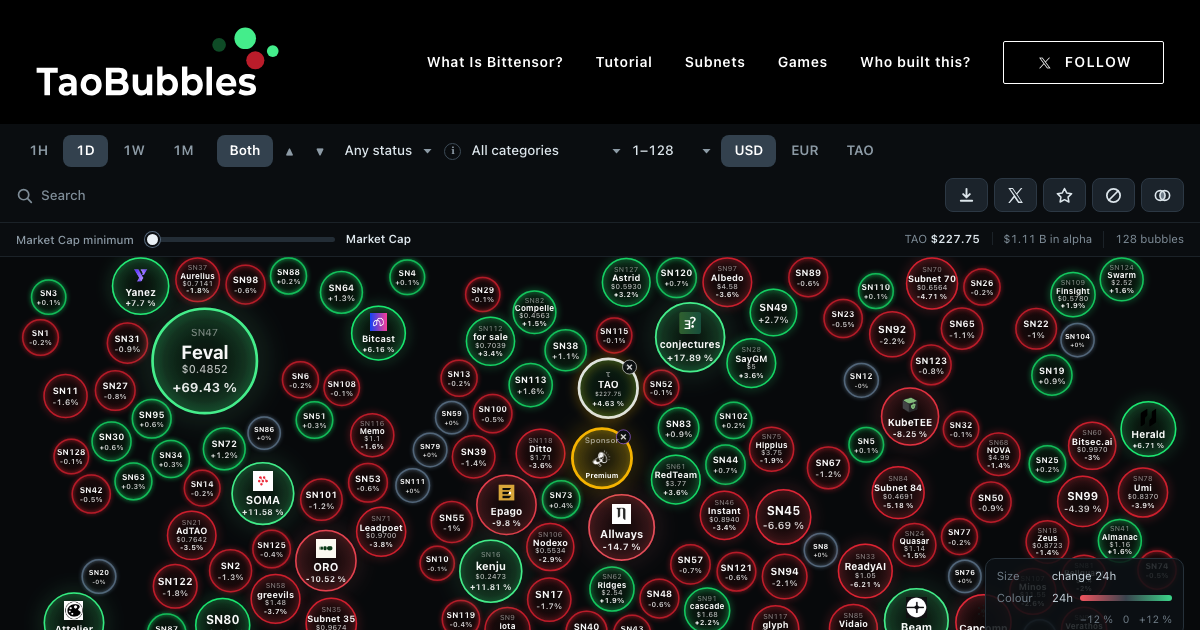
Following Bittensor often means opening the same few subnet pages every morning. TaoBubbles encourages a wider look. Its moving field of red and green circles gives unfamiliar projects a chance to catch your attention alongside the names you already follow.
The public dashboard turns subnet price changes into a visual market map. Time windows, currency choices and category filters let readers move from a broad impression to a specific question. In our September 16 walkthrough, searching for Chutes, switching to a weekly view and opening its data panel took only a few interactions.
What the biggest bubbles actually mean
Subnet bubble size reflects the magnitude of the selected period’s price change, according to the tutorial. The labeled sponsor placement is a separate, fixed-size advertisement. Market capitalization lives in the filters and table.
A small subnet with a sharp move can therefore occupy more space than a large project having a quiet day. Red and green give the direction. The same percentage move gets the same sizing treatment whether the price rises or falls, according to the platform’s tutorial.
This makes the map useful for noticing unusual activity. It also gives the viewer a reason to slow down before attaching importance to the largest circle. The table below adds price, market capitalization, 24-hour volume and a seven-day sparkline. Those figures help put the visual impression in proportion.
The four windows, 1H, 1D, 1W and 1M, make that second look easy. Switching from the day to the week changes the question from what just moved to how the move fits a longer period.
The filters give the map a purpose
Our most useful interaction was the category filter. Selecting Robotics and Autonomous Systems reduced the map to three entries at the time of inspection: OpenRoboto, Swarm and Nepher Robotics.
That gives a researcher a manageable group to examine. Each project still needs its own reading, especially where the category covers different products or stages of development. Even so, a sector view is a helpful starting point for someone approaching Bittensor through an interest in robotics, storage or computing.
The dashboard also offers gainers and losers, slot status, market-cap groups and a minimum-capitalization slider. These controls let the reader decide which part of the market deserves attention that day.
Currency selection deserves a place in that routine. We confirmed that switching from USD to TAO changed the displayed price, capitalization and volume units. For someone who thinks about subnet exposure in TAO, that removes a layer of mental conversion. USD and EUR remain available for a more familiar reference.
There is useful detail behind the animation
Opening the Chutes row brought up its category, description, liquidity, circulating supply, active-miner and validator counts, and price changes across four periods. A link leads onward to the full subnet page.
Keeping this information close to the map makes browsing feel less fragmented. A reader can notice a move, inspect the figures and decide whether the project merits further research without immediately leaving the page.
The URL recorded our period, currency and category selections; reopening the same view was not tested. The tutorial documents PNG export and X sharing. A visible Compare control includes bubble-to-bubble instructions, but those workflows were outside our test.
The visual format suits a quick daily check. The table gives it staying power for readers who want to work through the numbers.
Six priorities for deeper subnet research
These are our editorial suggestions, independent of TaoBubbles’ roadmap. We did not audit every part of the product to establish whether each feature is already available.
-
A visible data timestamp. Put the last successful refresh beside the map, with a clear stale-data state and a source timestamp inside exported images. A changing screen can feel current even when its underlying observation is several minutes old.
-
Liquidity context on the map. The details panel already includes liquidity. An optional overlay showing liquidity relative to capitalization, with its calculation explained, would help readers judge how substantial a large percentage move may be. Small-market moves deserve that extra context.
-
Named watchlists across categories. Saved groups could follow a research thesis, such as inference infrastructure or scientific workloads, even when the projects sit in different categories. A watchlist should reopen with the reader’s preferred currency and time window.
-
An event timeline with primary sources. Release notes, product openings, ownership changes and emission-status updates could sit beside price history. Readers could investigate timing through the linked evidence while retaining the distinction between an event and a proven explanation for a move.
-
Subnet identity history. A slot can acquire a new owner and project identity. Historical charts would benefit from visible boundaries around those changes, so an earlier project’s performance stays distinguishable from its successor’s record.
-
Historical snapshots that stay fixed. A dated, reproducible snapshot would let readers revisit exactly what a weekly recap showed, with its filters, values and source time preserved. It would complement links that reopen the latest market view.
The strongest next step would be to make the path from a striking bubble to a well-supported explanation shorter. TaoBubbles already makes the discovery part enjoyable. Freshness and historical context would give readers more reasons to return with harder questions.
Review scope and data limits
This review covers a desktop browser walkthrough on September 16, 2026. Search, weekly selection, currency units, category filtering and the Chutes details panel were tested. Export, X sharing, comparison calculations and mobile behavior were outside that walkthrough. TaoBubbles says its market data comes from the Taostats API and refreshes every few minutes; we did not independently audit its calculations or update cadence. A labeled sponsor placement also appears on the map, which the tutorial describes as fixed-size advertising. Price movement and participant counts alone establish neither product adoption nor investment merit.
Sources
TaoBubbles tutorial and data documentation
Was this article useful?
One tap feedback helps us improve each post.